3 Fracking Superstars
https://mail.google.com/mail/u/0/?hl=id&shva=1#inbox/140558f393dac909
There are a few truths to the fracking superboom going on in the United States:
- The U.S. is set to regain the crown as the world's energy superstar.
- Every fat cat OPEC member is shaking in his boots.
- You can bank up to 532% on the three best fracking plays I've found in my career.
Get all the details
here — before it's too late.
Economic Whitewashing
By Adam English | Tuesday, August
6th, 2013
The Fed and Commerce Department are starting to remind me of my deadbeat landlord...
A couple months ago, I noticed that the paint in my living room was starting to separate from the wall. I took a
picture and sent it over. I got no response.
A couple weeks later, the paint was peeling off... and something terrible revealed itself just below the
surface...
Thanks to problems with the roof and a downspout, I now have a patchwork of black mold as a roommate.
After increasingly dire and desperate voicemail warnings about the health risks, destruction of the wall, and a
reminder of legal obligations, I finally got some results. However, it was woefully insufficient...
A repairman stopped by, spent a couple of hours scraping off the old paint and wood, and repainted the wall. Nothing
was done about the downspout, the water running down and eating out the wall from the other side, or the actual mold.
All my landlord paid to have done was to put a fresh coat of paint over the rotting mess — one that will
continue to fester and worsen until it becomes a full-blown crisis and it costs far more to fix.
And then it struck me that this is precisely what the Fed and Commerce Department have been up to...
The Fed is throwing money at the markets, and the Commerce Dept. is slathering on a fresh coat of paint. Both are
obscuring the real problems we face.
Advertisement
Find the Sweet Spot... Guaranteed Gains
It's a simple but essential step that all professional investors take before putting one cent into a precious metals
mining company...
A vital number — one that every mining company has — that determines whether you make a
million... or lose it all.
Don't make another trade without learning what it is and why it's so important. Click here to learn more.
Constantly Paying to Treat Symptoms
For what seems like an eternity now, the Fed has been dumping money into the economy through its two-pronged
quantitative easing program.
On one front, it is buying up $85 billion
per month of the mortgage-backed securities from large banks, the very
securities that became virtually worthless as investors realized they
had been bilked into buying products designed to fail, as featured in
the
glowing press releases from the SEC following the recent guilty verdict
handed to a former Goldman Sachs trader. (Apparently, we're supposed to
believe the SEC has some teeth and will use them, assuming their target
is small enough...)
On the other front, the Fed is keeping
interest rates as close to zero as possible. The rate banks pay on
overnight
loans, or the federal funds rate, was at 4.5% in late 2007. As the
recession bit into the economy, it was slashed to virtually nothing.
Long-term rates quickly followed suit and fell from over 5% in 2007 to record lows near 1.4% in mid-2012. It wasn't
until May of this year that they crept over 2% again...
As a result, interest paid by U.S. businesses peaked in 2007 at $2.83 trillion, and then they fell sharply to $1.34
trillion in 2011, the last year data is available from the St. Louis Fed.
At the end of the recession in 2009,
quarterly earnings per share (EPS) for the S&P 500 were less than
$20, and
companies in the index paid roughly $4 a share in interest. Now those
figures are up to nearly $27 a share in quarterly EPS, but the companies
are
paying just $1.50 a share in interest on average.
Earnings have tripled since 2000, back when the economy was in far better shape (at least, for the little guys like
you and me).
The Fed has created a massive boom for corporate America through historically cheap debt — all at the cost
of anyone looking to limit their risk and protect their retirement funds.
Robbert van Batenburg, director of market
strategy at brokerage Newedge USA LLC, used data from the Fed and other
government sources to estimate that corporate savings on interest
expense after rates fell to historic lows has accounted for about 47% of
S&P 500
earnings growth since 2009.
The dramatically lowered interest rates account for almost 40% of total profit growth, according to van Batenburg.
And he didn't even include savings from lower leasing, or rental costs that indirectly resulted from the low rates.
Since the end of the recession in 2009, the S&P 500 has gone up roughly 86%. Without the Fed padding the numbers, it
would be reduced to roughly 45.6%. In turn, that would drive annualized gains from 16% down to 9.4% to date.
Throwing money at the problem didn't do anything for the massive increase in unemployed or underemployed Americans,
who obviously had no income to invest in the market recovery.
GDP growth has averaged less than 2% per year since the recession. We're not seeing results that match the out-sized
efforts.
The Fed has nothing left to offer for boost growth outside of QE infinite. It has removed all of its safety measures
and is running at full steam. Even hinting at an end to QE resulted in a 4.3% drop in the market.
Without meaningful economic reform, QE has become a perpetual maintenance
fee we're paying to stay out of touch with reality.
A Fresh Coat Coverup
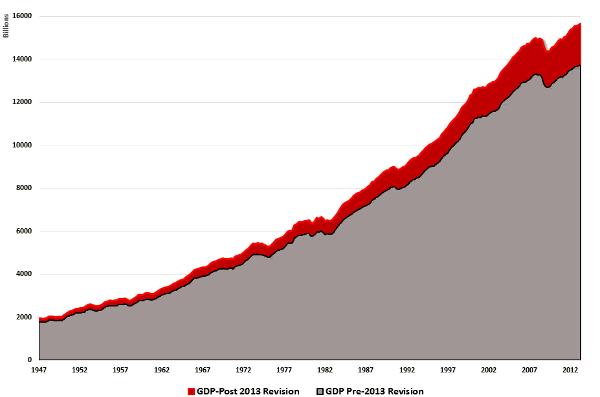
We just saw an overhaul of the official GDP numbers released by the Commerce Department.
The plan is to give a greater economic
weight to many types of intellectual property. Numbers will be revised
to add
in everything from pop culture to biotech drugs. As a result, our nation
just gained about $560 billion overnight. That means we're all about
$1,800
richer per capita!
Of course, that's only on paper...
It will also mask the downturn in real products that create lasting and meaningful growth.
Sure, summer blockbusters make hundreds of millions of dollars at the box office, but this is a one-time phenomena.
Unless that money circulates into tangible goods and long-term growth, it is functionally meaningless to economic growth.
And this is the crux of the problem: The revisions are only giving a boost
to GDP on paper.
No method of measuring GDP is perfect, but the old version did a decent job of reflecting the spending and capital
investments in machinery, equipment, and construction, which create long-term jobs and economic health for you and me.
Research & Development and Arts & Entertainment had very little impact on GDP up until 1983. A decade later, it had
grown from 1% to 2% according to the new GDP data. Another decade later, and it has now grown to 3.5% of the real U.S. economy.
The change will tweak the numbers to make the recession seem slightly smaller and the recovery slightly better.
Over time, this gap will continue to increase and effectively make our economic recovery look better and faster on
paper — while our dismal reality stays the same...
Considering government officials and the
press are breaking out the confetti and party hats when quarterly GDP
figures hint at 1.7% annualized growth, I guess every little bit counts
these days, regardless of how long it will take to claw back to economic
stability.
Advertisement
Have You Heard About This Government-Aided Profit Program?
I recently learned of an ex-fireman who's been using an underground profit secret to magnify his wealth many times
over.
It has nothing to do with stocks... options... bonds... or anything else you've likely come across.
Instead, it's a unique way to make money using a government-aided program that's been in place since 2010.
Hiding the Real Problem
Even with the Fed's efforts and the mirage of accelerated economic growth, there is no denying that economic growth
during our recovery from the recession was the worst after a recession in post-World War II America.
If you ignore the doctored unemployment figures and look at the big picture — as Shadow Stats does — it is the worst recovery for workers in our nation's history (although it does get kind of fuzzy going way back into
antiquity).
Check out the following chart.
SGS alternative employment includes discouraged workers who were removed from official statistics in
1994.

The Fed and Commerce Department can pad the numbers and put a fresh paint of coat on the
issue — just like my landlord did — but it won't stop the underlying problem from spreading and creating lasting structural
damage...
Consumer spending still makes up roughly
two-thirds of our economy, but is falling because an increasing number
of
people do not have a job or are underemployed; and real wages have been
stagnant for decades — and show no sign of improving for decades to
come.
If only making the market and official statistics look better on paper actually made our economy better...
Instead, this encourages politicians to leave everyday Americans wallowing in the cesspool of bad policies and
inaction that has become our status quo.
If only we could put our taxpayer dollars in escrow, like I'm considering with my rent
payments...
Maybe then they'd get the message. Maybe then they'd stop covering up the real issues we face and realize
that it will only get worse — and more costly — over the long run.
Take Care,

Adam English
Withheld Income and Payroll Taxes - Update
Please see our introductory pages on payroll tax receipts for some background information on this data series. Also our previous update (March 15th) for a discussion of 2012 potential tax receipt growth.
April and May Receipts - Comparison with 2011.Note: In all that follows, "Tax Receipts" and "Tax Deposits" refer to payments deposited by employers on the basis of payroll activity, and received by the US Treasury . The deposits consist of income tax withheld from employees, plus payroll taxes (i.e. Social Security and Medicare contributions made by both the employer and employees.) We analyze the Daily Treasury Statements and, despite any appearance to the contrary in the Treasury’s Monthly Statements, these two taxes cannot be separately identified at the time deposits are received.


The period of interest here starts mid-April, after deferrred year-end bonuses wash through the system.
The data show a year over year growth of around 3.5%. (In the second
chart, the data points in May at 2.5% and 4.5% are residual calendar
effects.)
Does this reconcile with other data?
Does this reconcile with other data?
The BLS Employment (Payrolls) Survey of April 2012 reported:
- Total number of non-farm jobs rose by 1.4% from April 2011 to April 2012
- Average weekly earnings for the non-farm private sector rose 2.1% in the same period. it is worth noting that net of CPI-U inflation, this change has been flat to negative in recent months.
Now, although the relationship between income tax withheld and
earnings is a non-linear one, it is approximately a one-to-one
relationship for annual income increases near to the IRS change in tax
bands of 2.5%. An estimate that tax receipts should increase by 1.4 +
2.1% = 3.5% is consistent with what we are seeing from the tax
receipts.
Note that the kind of monthly changes reported by the BLS are
relatively small compared to the variability we see in the noisy tax
data. No major discrepancies between the two are apparent currently.
The broader picture of tax growth over the past few years is shown below.

This material is provided under the ShadowStats.com Terms of Use. Use of this material constitutes agreement to those terms.
Privacy Policy | Contact Us
Copyright 2003-2013. Shadow Government Statistics, American Business Analytics & Research LLC.
Privacy Policy | Contact Us
Copyright 2003-2013. Shadow Government Statistics, American Business Analytics & Research LLC.
Read This Emergency Market Alert

The good news is the Ring of Fire is breathing new life into America's struggling economy.
And the best news is the Ring of Fire represents the single biggest wealth-creating opportunity I've seen in my career.


That's over a century's worth of domestic supply at today's consumption rates.
And at today's prices, that's literally TRILLIONS of dollars' worth of natural gas.
This vast supply is a game-changer.
According to Forbes Magazine:


I don't tell you this to brag, but to show you that when it comes to triple-digit winners, I'm as serious as you can get.
Your Time for Massive Gains is NOW

See what some of my readers have said:


Christian DeHaemer
Investment Director , Crisis and Opportunity
 The ONLY way to trounce gold's gains without having to buy coins, ETFs, options, major gold mining stocks, or tiny exploration stocks...
Dear Reader,
The ONLY way to trounce gold's gains without having to buy coins, ETFs, options, major gold mining stocks, or tiny exploration stocks...
Dear Reader,
http://www.angelnexus.com/o/web/48908?lloct=2&r=1
Two years ago, a stunningly-profitable gold investment algorithm made waves as it passed by word of mouth from investor to investor in Vancouver's exclusive and famously secretive precious-metals mining community...
Back then, the gold bull run was in full swing, and this algorithm quickly became a buzzword... first among the pros and then, eventually, with anybody interested in profiting off the precious metal trend.
The algorithm — nicknamed "Compound Gold" by insiders and private investors — took advantage of rapidly-rising gold prices to tap profits into formerly dormant mining operations.
Gains from this investment strategy could multiply the percentage gained by gold bullion by factors of 5, 10, 20 — even 50-fold or more.
Best of all, it's such a simple strategy to employ, it could literally be accomplished through a single trade on your online trading account.
Among these investors was the legendary John Paulson, who'd previously made himself a household name when he banked $2 billion shorting the housing market.
When he made his relatively quiet Compound Gold investment in 2009, few people took notice...
You can bet that things weren't so quiet when, 15 months later, Paulson walked away with $314 million in profit — having traded just one stock.
Since those early days of the previous metals bull market, things have changed. If you've been keeping up to speed on gold prices these days, or the outlook for the future, things don't seem quite as bright and shiny as they once were... at least, not at first glance.

After peaking out just south of $1,900/ounce in September of 2011, the gold market's cooled, gradually meandering down to a low of $1,354 in May 2013 before settling at its current price of $1,400.
As strong as Compound Gold was during those post-crisis years, the algorithm cooled right along with the gold market.
Of course, as you well know, with every depreciation in price, a whole new set of opportunities opens up for a low buy-in.

With prices now stable about 25% down from their 2011 peak, private precious metals investors — as well as the institutional investors like Paulson who routinely close 8- and 9-figure returns — are starting to eye the yellow metal once again...
Which means Compound Gold is about to kick it into high gear once again for another round of super-charged profits.
This time, however, there's a wild card in play that did not exist the last time the algorithm activated during the post-crisis gold rush... a unique, highly-guarded investment that for the past two months, even as gold prices took a downturn, has broken all the rules by giving investors the kinds of returns not seen since before the 2011 peak.
But as prices stabilize, and conditions begin to reset to reactivate Compound Gold trading, mining industry insiders are waiting with bated breath to see the true potential of this wild card.
In the next few minutes, I'll tell you everything you need to know about this one-of-a-kind investment, how you can get yourself involved with just a couple clicks on your online brokerage account and, most importantly, the eye-popping returns it could bring you within days of entry.
Before I get to that, though, I want to explain to you how Compound Gold works and why now — just like during the crisis years — investment pros and industry insiders are waiting for it to reawaken.
The Insiders' Secret: Compound Gold
There's an old joke in the industry that goes, "You can't mine gold
for $500 an ounce, sell it for $300, and make up the difference in
volume."
And that's precisely the problem with most companies that own property containing gold, silver, or anything else that's valuable...
Getting the valuable material out of the ground costs money... money that cuts into profits.
Cut enough of the profit and eventually, that land embedded with all those millions of ounces of gold and silver becomes worthless.
Just imagine... something worth billions of dollars — and nobody willing to shell out a dollar to own it.
Twenty-five years ago, when gold was trading at $350 and silver at $7, finding properties like this wasn't hard. More importantly, buying them was even easier.
Because no matter the size of the property — or how many million ounces of gold it held — anybody with an average-grade deposit who decided to start mining right then and there would be doomed to bankruptcy... making those properties worthless.
For those willing to bide their time, however, unimaginable fortune was around the corner.
Let's say you have a 3 million ounce gold deposit, an entry-level purchase for any major mining operation...
With cost of production at, for example, $400/ounce, that deposit would be functionally worthless when gold's market value is at $400/ounce. The owner would neither profit nor lose from the development of that property.
But if the market price rises by just a single dollar from that $400/ounce baseline...
That property suddenly becomes worth $3 million.
Historically, though, your gains would have been much, much bigger.
If you'd bought this 3 million ounce property back in February 1987, when gold was trading for $400/ounce, you'd have an asset with an overall value of zero dollars.
Three months later — when gold hit $470/ounce — that formerly worthless property would now be valued at $210 million.
By December of that year, with gold up to $500, it would worth $300 million.
Or if you want to look at it in terms of percentages gained:
Start with the same cost of production: $400/ounce...
If the market price of gold exceeded this $400 threshold — even by as little as 1% — this modest property which was worthless the day before... would suddenly become a $12 million dollar asset.
If a week later the price of gold went up a mere $8.00 per ounce (just 2%, based on mid-80s prices), the price of that suddenly valuable asset would double...
A 10% jump in gold price and the value is now up 1,000%.

But remember, the $400/ounce cost is just an example...
Every property — every mine — has its own specific break-even point.
Some higher-grade deposits break even below $400/oz, sending their stock skywards earlier on, while lower-grade properties break even well above $400/oz, launching their stock later.
The only trick is knowing that point and buying the stock when the market price of gold is as close to that point as possible: when the cost of production to gold market price ratio is near or at 1.

Hit that "sweet spot," and any subsequent jump in market price immediately launches the stock into exponential growth.
So it's not just a gold investment — but a Compound Gold investment, as it compounds incremental changes in gold price to generate major profits from a specialized type of property.
It's so efficient at gaining ground and so reliable, in fact, that Compound Gold trades have outpaced the world's single most popular gold investment, the SPDR Gold Trust (GLD) — which itself nearly doubled from $97 to $185 between November 2009 and late 2011 — by 458%.
And it doesn't just work for gold...
A company holding 85 million ounces of silver (not a large deposit by major industrial standards) that was worth zero dollars at $6/ounce... would be worth $17 million if the price of silver went up by just 20 cents.
If silver prices increase less than 10% — from $6 to $6.50 — our property would now be worth $43 million.
And if you'd bought this property in 1986... by the end of 1987, with silver at $10/ounce, this "worthless" property would have a net value of $340 million.
I know this comes off as amazing, but it's actually pretty simple; you just need the market to be heading in the right direction, and Compound Gold immediately picks up speed.
Here's what I mean:
When gold prices spiked back in the mid 1980s, millions of gold investors made 50%, 60%, as much as 80% on bullion.
A tiny handful of Compound Gold investors who had the skill and luck to find the right companies just as gold prices were reaching and exceeding their specific costs of production... made thousands of percent — hundreds of dollars returned for every dollar invested.

This sort of speed and reliability puts Compound Gold in a class of its own among gold investments.
It was so powerful that it gave rise to a whole new class of investors — and helped the precious metals mining industry explode into the sector it is today.
But here's the catch: There are times when this method simply won't work.
You see, back in the 80s, we were in the midst of one of modern history's greatest precious metals bull markets. But just before the run started in 1985, a few people who knew what was coming went around deserted stretches of land in North and South America, buying up seemingly worthless tracts of land — land where there were proven gold deposits, but where the cost of production would bankrupt a company in short order.
And then the boom hit — and it was time to sit back and watch the profits collect.
Of course, nothing good lasts forever. When the precious metals bull market cooled off in the 1990s, anybody working this tactic would have to stop operations... and wait until the next one.
That next one came around after the economy crisis of 2008... and lasted a good three years before this most recent cooling off of the market.
But now, it looks like we've finally hit the reset button. And with gold just barely touching $1,400/ounce, there's a lot of room for growth in the near term.
As you just learned reading about the simple mechanism behind Compound Gold, with each dollar that gold gains... properties and companies that had never been profitable suddenly cross over into the black and transform overnight.
It paused for a while after the 2011 peak — but as prices hit multi-year lows, the moment to take full advantage of it all over again is here now.
The New Bull Market is Just Getting Started...
Even after recent slumps, you still can't open a newspaper or click
through a financial news site without seeing quotes like these:


5 Reasons Gold Will
Continue to Rise
1) Economy
The U.S. manufacturing base has been shipped overseas. The few jobs being created are in the service industry or government sector. The official unemployment rate hovers near 10%, and 1 out of every 5 Americans is on food stamps. The 2008 economic implosion destroyed the real estate market, sent foreclosures skyrocketing, and swallowed up a nearly $1 trillion bailout... and yet, most experts predict the worst is still to come.
2) Fear
The sovereign debt crisis threatens to spread across the globe. Fearful investors are shifting assets from the euro and other weakening currencies into gold. The stock market rebounded from its 2008-09 depths, but some analysts say it's overbought and due for painful correction. Meanwhile, turmoil across the Middle East, Asia, and elsewhere is exacting huge costs in American blood and treasure...
3) Demand
The Federal Reserve has kept U.S. interest rates at virtually zero with no sign of a hike on the horizon, thereby lowering the opportunity cost of buying gold. And investors have responded with astonishing eagerness, even forcing the U.S. Mint to ration popular bullion products in order to meet overwhelming demand. Expect central banks in China, India, and Russia to fuel demand for gold.
4) ReflationOf the major assets, only Treasuries and gold have escaped the selling panic that has gripped the markets. Rushes on gold have caused mints around the world to run out of popular gold coins. Because of the inflationary impact of government bailouts, $2,000 could be the floor, not the ceiling.
5) The DollarDollar weakness, plentiful liquidity, and policy reflation will be persistent themes in the future. Massive fiscal and monetary stimulus have weakened the dollar, whose current resurgence stems mainly from the European debt crisis. Once that crisis reaches the debt-burdened United States, the dollar's weakness as a currency will be evident to all — and its role as the world's reserve currency will be in jeopardy. As always, gold will be the first and most universal remedy.
But with today's gold price at $1,400, finding companies with the
perfect cost of production levels is actually easier than it was two
years ago.
Companies with production costs at or near today's Compound Gold sweet spot are more common today because there is so much more room to profit.
The profit potential for this highly-specialized breed of companies is simply staggering — easily as strong as it was in the days when Paulson made his storied purchases, and far, far in excess of anything we saw back in the early bull runs of the 1980s.
Remember, for gold to just rise a few dollars is enough for these stocks to start doubling or tripling.
Dare to think big, though, and you'll see the real opportunities start to materialize...
If gold itself doubles, you could be looking at 100, 500, even 1,000 times your initial investment.
Just imagine investing $1,000 today... and in two years, cashing out a cool million.
All that matters is finding the right company — with the right cost of production levels — and waiting for that sweet spot.
I know what you're going to say: All these theories and stories are great... but you want to see a live example of what happens when a company hits the Compound Gold sweet spot.
Instantly in the Black: South American Silver Corp
Like I mentioned before, what works for gold also works for silver, and here's an example of just that...
In October of 2009, South American Silver Corp. (SAC) was a tiny $13 million company trading at 13 cents a share.
Investors looking at just the stock value would have been misled, because within SAC's property in Bolivia was an estimated 322 million ounces of silver.
Even at 2009 prices, this deposit had a theoretical value of over $5.1 billion.
But here's where the algorithm comes in...
Because the low-grade ore found in great abundance on this property would cost about $20/ton to process into raw silver, the owners of this property would have been losing $2/ton on their investment (at late 2009 silver prices).
Their $5.1 billion asset wasn't an asset at all. It was a liability.
But over the next 20 months, the price of silver did something spectacular:

In a rally to rival all rallies, silver jumped from $18.50 an ounce to over $50!
That's a gain of over 170%.
Not bad, right? You could have invested $10,000, and by the summer of 2011, cashed out with $27,000.
But remember this: At $18/ounce, SAC was virtually worthless... but at $50/ounce, less than two years later, this company was profiting $32/ounce!
At that price, the entire property had a total resource value of $16.1 billion — with $10.3 billion of that being pure profit.
In case you can't imagine what that does to a company's stock price, here's what South American Silver Corp looked like as it passed its sweet spot last year:

Between September 2009 and April 2011, South American Silver went from 13 cents to over $3.00 for a gain of 2,307%.
So if instead of putting that $10k into raw silver, you bought SAC just as its cost of production hit that sweet spot...
You'd have made a pre-tax profit of $230,000.
It's not a trick, it's not a fluke, and you don't need any specialized brokers or understanding of finance to execute... With a single trade, anybody who knew the cost of silver production for this one Bolivian property would have made millions in less than two years' time.
Want another example?
Here's Copper Mountain Mining Corporation (CUM).
It hit its break-even price back at the end of 2008, when gold prices were at $800/ounce. In the two years since, as the sweet spot came and went, the stock looked like this:

So while gold doubled to $1,830 an ounce in the 26 months following that magical sweet spot, this company went from 40 cents to $8.00 — a self-sustained gain of 2,000%.
The gains took the company up from a tiny $30 million exploration outfit to an exploding $600 million gold mining powerhouse... and would have turned a $10k investment into $200,000.
Here's a third example: Agnico-Eagle Mines Ltd. (AEM).
This one goes back more than a decade — and illustrates the point that every property has its own specific break-even point, which can be exploited.

As the gold market picked up after going through a dry patch in the 90s, the profits on paper suddenly materialized, and the value of this company's property shot up exponentially.
It took a little while longer than usual, but in the end it was a monster success story — gaining 2,600% as it climbed from $3 to $80.
Not convinced?
Here's yet another example...
 This company, Gabriel Resources (GBU), hit its sweet
spot back in 2009. By mid-2011, it had grown by over 800% into a $2.5
billion giant. (In that same time, gold only rose by 60%!)
This company, Gabriel Resources (GBU), hit its sweet
spot back in 2009. By mid-2011, it had grown by over 800% into a $2.5
billion giant. (In that same time, gold only rose by 60%!)
This wasn't that small of a company to begin with, but an established firm worth hundreds of millions. Regardless, its rise was so easy to predict — and so reliable — that billionaire investor and hedge fund superstar John Paulson bought a full 18% of the company.
The purchase was just one of the many gold investments he made that year... Paulson also invested heavily in physical gold, as well as a number of larger North American producers.
But this play was by far the strongest-gainer of the bunch, helping to make 2010 the biggest year of his already legendary career.
1.) International Tower Hill Mines Limited (THM): December 2008: 98 cents — January 2011: $10.00 (1,020% GAIN)
2.) Northern Dynasty Minerals (NAK): November 2008: $1.80 — February 2011: $21.90 (1,216% GAIN)
3.) Teck Resources Limited (TCK): March 2009: $3.30 — January 2011: $61.00 (1,848% GAIN)
4.) New Gold Inc. (NGD): December 2008: $1.70 — August 2011: $13.07 (768% GAIN)
5.) Osisko Mining Corporation (OSK.TO): December 2008: 75 cents — December 2010 $16.00 (2,133% GAIN)
And that's just a small sampling...
Which illustrates my final point: Professional investors and industry insiders have been banking billions off this method for years.
In other words, using this basic principal isn't a new or novel idea. In fact, many of the professional commodities investors refuse to make any trades in which this algorithm hasn't predicted success.
Unfortunately, this simple yet essential system of investment is almost completely overlooked by do-it-yourself investors. This baffles me, but it's just a fact of life in today's financial world...
A vast majority of today's investors have simply never heard of Compound Gold — nor do they understand the basic principal behind its pattern of success.
So you can already consider yourself a member of the elite. After all, you already know how and why this system works and the basic principal behind putting it into action to make yourself tens, even hundreds of times your money back in short order.
But picking the right company can still be tricky... There are so many to choose from, and digging through quarterly financial statements to come up with that perfect cost-of-production isn't exactly a weekend activity for everyone.
To my good friend and colleague, precious-metals guru Greg McCoach, it's a full-time job — and a career-long obsession.
And what he recently discovered is a company that's turned the Compound Gold concept on its head.
I Don't Specialize in an Industry; I Specialize in Making Money
My name is Jeff Siegel. I am the Investment Director and Managing
Editor of one of Angel Publishing's longest running and most iconic
investment newsletters, Energy and Capital.
One of our closest industry contacts — and one of my long-time friends — is the editor of our precious-metals newsletter, Mining Speculator. His name is Greg McCoach. Greg has been a specialist in the field for over two decades. And he's asked me to write him an intro to bring Compound Gold to a never-before tapped audience...
Just recently, Greg identified a gold mining company that seems to have shattered the mold.
This company — trading at around 70 cents — is still considered a junior miner.
For the last two months, it's been doing something quite remarkable...
While gold's been declining, eventually settling down at $1,400, this company's stock was flourishing — more than tripling in just several weeks in May of 2013!
Now, Greg's had this eye on the company for awhile, before any of this recent movement started.
The reason? He's got a proven method for weeding out the true winners from among the scores of average mining companies operating in this sector.
Over the past 25 years, Greg's experience has shown that there are three critical elements to raking in eye-popping returns...

#1. The Advantage of Junior Mining Companies
Why invest in juniors?
That's easy — money and unparalleled leverage.
You see, it's not uncommon for junior-mining companies to experience huge gains (tenfold or more) very quickly as news of a discovery leaks out.
And the payback on a new find increases exponentially.
You see, in the mining world, it's no secret that most mineral deposits are found by junior mining companies and individual prospectors.
There are several reasons for this:
 Junior explorers are not slow-moving bureaucracies like many senior
companies; juniors make fast decisions both in the boardroom and in the
field.
Senior
resource companies generally have a different role to play — namely, to
fund and put into production deposits discovered and developed by
juniors.
But it's the talent, motivation, and dedication of their management teams that is the secret to most juniors' success.
Junior explorers are not slow-moving bureaucracies like many senior
companies; juniors make fast decisions both in the boardroom and in the
field.
Senior
resource companies generally have a different role to play — namely, to
fund and put into production deposits discovered and developed by
juniors.
But it's the talent, motivation, and dedication of their management teams that is the secret to most juniors' success.
When investing in a junior mining company, you're investing in its management team as much as you are in its promising projects... which leads us to the second critical element to raking in eye-popping returns...
#2. Know the Management Team Inside and Out
When Greg studies a company, he spends hours, days, and weeks with CEOs and geologists — even with companies he never actually recommends!
This is the only way to truly get a feel for their expertise.
After all, in the mining business, if an exploration geologist finds a mine, it's likely that he'll find others...
It's a fact that far fewer than 5% of all exploration geologists will ever be credited with a discovery leading to a producing mine. What's more, less than one out of every 1,000 exploration sites will ever turn into a mine.
But those select, gifted explorers who find numerous mines seem to have a sixth sense that helps them to succeed.
Finding these geologists isn't the easiest task in the world. But they're all drawn to it for the same reason: money.
It's the huge potential that comes when a discovery is made.
You see, as part of a junior mining company, the geologist who makes the discovery might get $10 million, $20 million, or $100 million in capital gains for his efforts.
After all, in the life cycle of a mining stock, it's the exploration phase that provides the biggest move in share price (leverage).
The best and brightest mine finders know it. And they'll search the world over to make a new discovery.
When they do, the monetary rewards are tremendous — for both the management team and for investors.
#3. The Simplest and Most Overlooked Part of Making a Fortune in Investing
It's best summed up by J. Paul Getty, one of the most successful investors of modern times.
What did Getty know about building wealth and investing for spectacular gains that his contemporaries didn't?
Several years before he died, Getty shared his "secret" in his autobiography...
He explained that whenever he made an investment, he tried to apply this simple principal: If you want to make money, really big money, do what nobody else is doing.
In Getty's own words, "Buy when everyone else is selling and hold until everyone else is buying."
This isn't merely a catchy slogan. It's the very essence of successful investing.
But as simple as it sounds, too many people do just the opposite. They buy high and sell low. They're trend followers. To put it more bluntly, they follow the crowd.
The successful investor is a trendsetter, not a trend follower. He gets in — and out — ahead of the crowd.
Now, the company I've been teasing this whole time clearly falls into all three categories:
You'll Make Triple-Digit Gains — OR IT'S FREE!
Used properly, the information in mining legend Greg McCoach's newest report will be worth hundreds of thousands — even millions — of dollars to individual investors who get in early enough.
Most resource and mining traders would be happy to pay upwards of $2,000 and as high as $5,000 to get the jump on a Greg McCoach play. To them, it's minuscule overhead for the profit potential they're getting.
Right now, Greg is offering this report along with a year's subscription to Mining Speculator for just $49.
That's less than 15 cents a day for a shot at making thousands in one simple trade.
I pleaded with him not to go so low on his subscription fees, but instead of listening, Greg took it a step further... and I had no choice but to accept his terms.
He's so certain your Compound Gold stock will go up by at least 100% before the coming winter that if it doesn't work — for whatever reason — Greg and I will refund every penny of your subscription to Mining Speculator.
Bottom line: Either you double your money in the next six months — or you pay nothing.
No small print, no exceptions, no excuses.
Make 100% or get your money back. Period.
And listen, if at any point during your first six months you're unhappy for any reason at all, just say the word and I'll send you a check in the amount of your subscription fee...
6 full months. Any reason at all. No questions asked.
No matter what you decide, however, you get to keep your copy of Greg's breaking report, called: "Compound Gold: Ride the Gold Bull to Exponential Gains."
For the introductory price of $49 you will also receive:
The upside here is staggering. I'm not exaggerating in the slightest when I say that this opportunity can potentially alter your life forever.
But you must move quickly...
Because this opportunity is so explosive — and because this company is still a closely-guarded secret within the investment community — I am limiting the number of subscriptions to just 200.
Once we hit that number, I'm closing the file, sitting back, and waiting for the real action to start.
The way things are progressing in the gold market, I wouldn't be surprised to see my new recommendations double or even triple in the coming weeks...
Things are only going to move faster, and you need to position yourself now to ensure full profit potential.
So please, take a moment right now to reserve your space.
However you choose to order, please do it now.
This opportunity won't wait...
Good Investing,

Jeff Siegel for Angel Publishing
P.S. This trade must be executed within the next seven days. With the recent fluctuations in gold prices, and with major movement on Greg's new gold mining stock, I cannot guarantee that this opportunity will be around much longer... Every day is another day of lost gains. Don't miss out an another dollar of profit — click the button below.
The "Ring of Fire" Millionaires
http://www.angelnexus.com/o/web/48906?lloct=2&r=1
Deep in
the heart of Flyover Country, USA, sits a 1,000-mile-wide circle called
the Ring of Fire. This "Ring" has created more millionaires in the last
five years than Apple or Google combined.
And that's just the start...
Revealed Today: How a Secret Catalyst will Unlock Up to 532% Gains from the Emerging Natural Gas Market No One's Talking About
Dear Reader,
One hundred and ninety-eight miles north of the City of Brotherly Love sits a tiny jerkwater town called Towanda.
You've probably never heard of it... and quite frankly, who would have?
Towanda is a Native American name that means "burial ground.” And for the past few decades, Towanda was exactly that: a dying old industrial town that lifelong residents were fleeing as if it were on fire.
Settled in 1784, Towanda was once known primarily for its industrial
factories — which included flour, toys, silk mills, and a foundry.
The population was 4,663 in 1900 and 4,281 in 1910. As the town's
manufacturing base left to seek cheaper labor costs, its population
decreased...
The most recent census report had Towanda with a population around 3,000.
But that has changed practically overnight.
"Help Wanted" signs are now the most popular advertisement in store windows.
You see, Towanda is a borough in the County of Bradford County in
northeastern Pennsylvania. It sits on the northeastern part of a massive
oil and natural gas formation we call America's Ring of Fire.
The wealth that's flowing in from natural gas and oil is literally transforming towns like Towanda all across the Ring.
Towanda resident Chris Sutton became a millionaire practically overnight...
Sutton leased his 154 acres of land on the Marcellus Shale to
Talisman Energy for a $900,000 up-front check — plus a 20% cut of the
revenue of the natural gas extracted from his land.
The good news is the Ring of Fire is breathing new life into America's struggling economy.
And the best news is the Ring of Fire represents the single biggest wealth-creating opportunity I've seen in my career.
Some folks in the Heartland have likened it to the next gold rush — or even the start of another Industrial Revolution...
And that's no exaggeration.
When this bull market hits critical mass, new millionaires will be minted by the hour.
Read quickly, though, because this market is already starting to heat up...
I'm expecting gains like the one below from Cove Energy in just a few short months:
Or the whopping 950% gain from Westport Innovations, a company whose future rests solely inside the Ring of Fire:
That's why I'll share with you today exactly how to play this rush by detailing two companies.
PLUS I'll reveal the secret catalyst that I expect will easily push these stocks to gains of 532% — maybe more.
Before I get to the details, let me show you just how profitable this situation could be...Epic Landgrab Spurs Triple-Digit Winners
Right now all across the Ring of Fire, a gold rush-like landgrab is taking place.
Why?
The Ring of Fire is home to the largest shale gas and oil reserves in the world...
Virtually overnight, landowners become "Ring of Fire millionaires" —
and towns near the coveted reserves are bursting at the seams.
In Mansfield, Louisiana, Scott G. quit his job at a local paper mill.
He's now a cattle rancher, thanks to the money he got from this
historic landgrab.
Scott paid $70,000 cash for a tractor, and when he offered to pay
cash at the dealership for the new Corvette he wanted, the salesman
laughed... so he walked out.
Now that's financial freedom, my friend.
Scott's living proof that the American Dream is still alive and well.
The entire Desoto Parish in Louisiana (where Scott lives) is enjoying
a boomtown effect not seen since the railroad booms of the mid-1800s.
A few years ago, this tiny little Parish was one of the poorest in all of Louisiana.
Since that time, 11 of the 12 schools are set to get new buildings — paid for in cash. You read that right: cash.
Yes, the fuse has been lit for the biggest new bull market of the 21st century...
Most investors don't know it yet, but there's a piece of legislation
in Congress right now that will send two stocks I've been tracking on a
huge run to higher prices.
(Here's a hint: Both companies are perfectly positioned to exploit
Uncle Sam's rush to subsidize the use of natural gas. And each is easily
set to return early investors 500%, maybe more.)
I'll detail everything you need to know about both of these
under-the-radar gems in a special report I'd like to send you for free.
But you'll need to act fast...
Those of you who get in early will reap the rewards. Those who don't — well, that's not our problem...
Bank Triple-Digit Gains from the "Next Gold Rush"
"The next gold rush" has started in the United States.
According to the Energy
Information Administration (EIA), the United States is sitting on over
862 TRILLION cubic feet of natural gas buried in shale gas reserves
throughout the Ring of Fire.
That's over a century's worth of domestic supply at today's consumption rates.
And at today's prices, that's literally TRILLIONS of dollars' worth of natural gas.
This vast supply is a game-changer.
And right now, there is a little-known piece of legislation sitting
in Congress that, when passed, will propel the companies I'm
recommending into once-in-a-lifetime profit plays.
The rush to tap these massive shale reserves has touched off one of
the biggest job and industrialization booms since World War II.
Consider this: Since 2006, the technology industry has fired 330,000 people and the "green" sector lost another 480,000 jobs.
While those industries were busy losing jobs, the natural gas job market can't add workers fast enough...According to Forbes Magazine:
Ohio now has over 64,000 wells, with five hundred drilled just year.
Recent
and potential finds, particularly in the Appalachian basin, could
transform the Buckeye State into something of a Midwest Abu Dhabi,
creating more than 200,000 jobs over the next decade.
And that's just in one state in the Ring of Fire...
The same thing is happening in Louisiana and Texas, in Colorado and North Dakota.
Across the nation, oil and natural gas production has grown by an amazing 60%, adding 500,000 new jobs.
And get this: The average salary in conventional energy pays $100,000 — more than double the median income.
Energy research group Wood MacKenzie says the industry could tack on a jaw dropping 1.4 million more jobs by 2030!
Put simply, shale gas and oil is where the jobs are, where the money is, and best of all, where individual investors can make the biggest profits.
In fact, the list of big players lining up to claim their riches
looks like a Who's Who in the world of billionaires and
mega-corporations.Sell Exxon — and Buy the REAL Cash Cows
Not too long ago, Exxon shocked virtually everyone in the resource
world by buying XTO Energy for a whopping $41 billion dollars.
(You may not know XTO, but suffice to say they were one of the largest wildcatters in the U.S. natural gas business.)
Exxon's $41 billion buy-in signaled just how immense the potential
for profits are in the shale gas fields all through the Ring of Fire.
And they're just one of the huge resource companies falling all over themselves to buy in to the profits hidden in the Ring.
Big hitters like Australia's BHP Billiton, Norway-based Statoil, and China-owned Sinopec have each paid billions of dollars for Ring of Fire real estate.
Every single one of them gladly paid obscene amounts of money to get
not only their share of the natural gas profits... but just as
importantly, the fracking technology perfected within the Ring of Fire.
The thing you must know right now is I'm not recommending a single one of these companies. They're too big and the potential for profit is just too small.
The opportunities I'll show you in a just a minute are far off most investors' radars...
In other words, their potential is immense.
Opportunities like when I led my readers to a staggering 759% on
Petro Matad in only 10 months... or the 236% I showed them in Sharon
Gol.
In fact, this situation is so ripe for fortunes to be made,
billionaire investors George Soros and T. Boone Pickens have thrown
money into the game. And I'm not talking seed money here — unless you think a $122 million investment by Soros in one company alone is small potatoes...
Why does he believe so much in this company?
It's all tied to a bill going through Congress right now called House Resolution 1380...HR1380: The Secret Catalyst to 532% Gains
HR1380 is dubbed the New Alternative Transportation to Give Americans
Solutions Act — or for short, the first letter of each word: NATGAS.
Clever, right?
When passed, this little-known resolution will effectively end
American's dependence on foreign oil. More importantly, it will kick off
one of the biggest transportation transformations the world has ever
seen.
I know that may sound bold, but it's true. Because HR1380 is the first thing the government has gotten right in years...
You see, Uncle Sam is offering a $64,000 tax credit — PER TRUCK — to
swap out diesel engines with engines that will run on natural gas. And
at the going rate of $4.12 a gallon for diesel, everyone in the transportation industry has been looking for cheaper fuel alternatives.
And here's where the opportunity gets really big...
The liquefied natural gas equivalent to gallon of diesel is less than a buck.
So not only is natural gas over 75% cheaper than diesel, now Uncle Sam is going to PAY companies to switch over to natural gas engines.
In the next five years, the number of natural gas-powered vehicles will shoot from nearly 100,000 to well over 700,000!
And just when you thought it couldn't get any more interesting, there's one more thing you should know...
Uncle Sam also wants to hand out up to $100,000 in tax breaks to companies that provide natural gas refueling pumps!
The signing of NATGAS will send companies that have expertise in
natural gas-powered engines and natural gas refueling capabilities into
the stratosphere.
And that's where the billionaires come in...
You see, HR1380 is also affectionately known as the Pickens Bill, named after billionaire T. Boone Pickens.
And why is Pickens interested in natural gas?
BIG money, plain and simple.
Pickens owns the option to buy 15 million shares at $10 each of a company called Clean Energy Fuels Corp. That's a $150,000,000 bet on their success.
And what do they do?
They provide natural gas for transportation — in other words, they're a gas station for natural gas-powered vehicles.
But the billionaire buy-in list doesn't end there...
Warren Buffett's notoriously green-energy focused MidAmerican Energy Company is a player.
Hell, even Democrat Nancy Pelosi has a hundred grand invested in the same company Soros does...
But that pales in comparison to the $122,000,000 stake Soros has — or Pickens' $150,000,000 bet on the outcome of HR1380.
I shouldn't have to tell you that when billionaire titans and greedy
politicians put their financial weight behind something, and start
placing big bets on the outcome, the potential has to be immense — and
the outcome all but certain...
I've found the two small companies poised to reap the biggest rewards when HR1380 passes.
In fact, I just finished a report called: "Profiting Big from the HR1380 Transportation Transformation."
Within its pages, I'll give you all the details on both small companies that return up to 532% — maybe more.
I'll tell you how to get this blockbuster report for FREE in just a moment.
First, let me give you a sneak peek into just how big the opportunity is...
Profit Opportunity: "Profiting Big from
the HR1380 Transportation Transformation"
the HR1380 Transportation Transformation"
The paradigm shift in this shale gas explosion is the vast supply.
It's why I'm so bullish on this opportunity.
Because you need to have energy in abundance for there to be a fundamental shift in its use. And it's got to be cheap.
Don't just take my word for it...
Here's an excerpt from "Investing in America, Building an Economy that Lasts," produced by the White House:
An abundant local supply will translate into relatively low costs for the industries that use natural gas as an input.
Expansion
in these industries, including industrial chemicals and fertilizers,
will boost investment and exports in the coming years, generating new
jobs.
Think about it... Who's going to spend hundreds of millions of
dollars in capital investments for an energy source that has low supply
and high costs?
No one!
And that's why the passing of HR1380 is so important.
As I said, HR1380's goal is to provide huge tax breaks to companies
that build vehicles which use natural gas for power, or to companies
that provide the refueling capabilities for those vehicles.
Basically, the U.S. Government is saying they will subsidize the race to use cheap fuel.
The first company I'm recommending to you supplies engineering services and fuel delivery systems used in natural gas engines.
Every manufacturer that jumps into building natural gas-powered engines will need their engineering expertise and their products.
That alone has them poised to double, maybe even triple, profits from the passage of HR1380.
But what puts them head and shoulders above every other player is that they also provide the same types of services and products to natural gas storage and fuel distribution facilities...
The very ones that will be built by the hundreds when HR1380 is passed.
This company's got both sides of HR1380 covered, and when the bill is signed... their stock will soar.
532% could just be the beginning!
It's the surest thing to a slam-dunk five-bagger I've seen in 20 years.
In fact, the last time I saw anything close to this kind of potential was when I got my readers positioned for the rise of Internet gaming in China.
That explosion took GIGM from $2 to $25... good for a wallet-busting 1150% gain to those who got in early:
Or when the car market hit the skids — and car parts company AutoZone (AZO) went up $250.00.
But it's easy to see that the move to natural gas will be much bigger than either of these situations.
Sometimes, the next big trend isn't clear until it's too late to get it...
Now's probably a good time to mention that I've earned my reputation on spotting trends early — and making my readers rich.
That's why I'd like to send you my special report, "Profiting Big from the HR1380 Transportation Transformation."
This report includes the ticker symbol, company details, and the price you need to get in at to profit the most.
Now let me tell you a little bit about the other company I'm recommending, because this opportunity is already heating up as you read this...
You see, Wall Street barely realizes the potential of company #2 because they look at it the wrong way.
And that's why it's currently such a bargain.
Put quite simply, they're a manufacturer of heavy-duty vehicles like
trucks, buses, and RVs. While their brands are fairly well-known, what
most investors miss is their potential to skyrocket when HR1380 is
passed...
Because unnoticed by many, they've just announced their intent to offer natural gas-powered vehicles.
And just as overlooked is their partnership with Clean Energy Fuels Co. — the very same Clean Energy Fuels that T. Boone Pickens has a stake in!
Not only is this company going to benefit from the huge government
subsidies of HR1380; they're also assuring their vehicles can refuel
with natural gas, which will catapult their rate of adoption.
If this looks like the biggest home run Wall Street is missing, it is!
But it won't be for long...
And if you needed a kicker for this one, think big: They also have an extensive international distribution network.
So when this cheap energy explosion ripples through the world markets — and it will — this company is poised to see their fortunes multiply tenfold.
I'm so certain of the fortune-making potential of this rush that I want to send you "Profiting Big from the HR1380 Transportation Transformation" for FREE.
Why Listen to Me?
My name is Christian DeHaemer.
I'm the founder of the Crisis & Opportunity investment advisory service.
Unlike many "editors" in the financial business, I'm a boots-on-the-ground kind of guy.
Maybe I get that from my military background, or maybe it's the
simple fact that I learned long ago that if you want to find out what's
going on somewhere, you have to go there...
And go "there" I do.
Over the past 15 years, my passport has gotten quite a workout. It's
tattered and dog-eared — and has a few stamps that conjure up memories
of stories I just can't tell you...
But there's one thing that visiting places like Egypt, Cuba, Tunisia, Mongolia, Libya, and Israel has taught me that I can share with you: how to get eye-popping gains.
Winners like:
759% on Petro Matad 162% on Markland Technologies
235% on Fieldpoint Petroleum 515% on Palm Resources
243% on Cemex 251% on Unilife
256% on Allied Nevada Gold 131% on Richmont Mines
351% on Entree Gold 268% on China Yuchai
"The best news today is that gains like these are possible right here in United States, thanks to the Ring of Fire."
— Christian DeHaemer
I don't tell you this to brag, but to show you that when it comes to triple-digit winners, I'm as serious as you can get.
Your average Wall Street shill couldn't find half the triple-digit winners I have all over the world, much less right here in his own backyard...
He's locked in his cushy office behind his mahogany desk.
He's part of the problem.
Unlike him, I work for you.
Your Time for Massive Gains is NOW
You're sitting on the edge of one of the greatest investing opportunities of your investing lifetime...
The American Dream has new life being breathed into it every single day inside the Ring of Fire.
And I want you to realize that dream, too.
That's why I'm going to make you this offer:
I want you test-drive my world-class advisory service, Crisis and Opportunity.
In exchange for taking this test-drive, I'll send you the special report "Profiting Big from the HR1380 Transportation Transformation."
This report is just the tip of the iceberg, though.
Because I've just uncovered another massive opportunity in the making — and when you join me today you'll also get...
A Bonus Ten-Bagger
Playing Government Regulation
Playing Government Regulation
Whenever ANY industry shows as much potential as this shale gas revolution, someone's always going to be unhappy.
Even with all the pro-energy comments coming out of the White House
right now, the simple truth is the government loves to regulate...
And at the head of the enforcement line is the Environmental Protection Agency (EPA).
Every single energy company that's got a stake in the Ring of Fire wants to avoid lawsuits and EPA sanctions like the plague.
It's one trend you can always count on: big companies working hard to hold on to their money.
The good news is for every problem, there's always a profitable solution.
And the best news is I've found a little gem trading under $1
a share that's ready to reap huge gains by tackling the cleanup of the
fracking process.
This little beauty holds 13 patents for a process that eliminates the
need to truck wastewater from the fracking wells to off-site holding
ponds, saving the energy company millions in lost time and expense.
Their process also renders the water 100% reusable.
How big of a deal is that?
The average horizontal shale gas well requires about 4.5 million
gallons of water to support the fracking process... or enough to water
your local golf course for 25 days!
Now imagine that scenario played out thousands of times in just the United States alone...
That's a mind-boggling amount of water.
And while water is more plentiful within the Ring, a lack of clean
water could completely derail fracking for natural gas in many other
countries.
So to say this company presents a valuable environmental and efficiency solution is an understatement.
The best part is this company will clean water at half the price of its nearest competition.
They have just started to get the word out...
Once this story makes the mainstream press, it could easily hit $2-$5 a share.
When you join Crisis and Opportunity, I'll also send you the free bonus report called: "Water Profits: How a Tiny $0.75 Company Will Clean Up Fracking and Make You Rich."
This bonus report details everything you need to know about the tiny
water cleaning company to get in early and bank massive gains.
It's just one more example of how I'm looking at every conceivable angle where you can make mammoth profits from this bull market inside the Ring of Fire.
Grab Your Share of the Riches
When you're as serious as I am about success, you know it takes a complete approach.
That's why when you try out Crisis and Opportunity, you'll also get exclusive access to:
-
My Special E-alerts – Get breaking news on emerging profit opportunities as I find them. The three companies I've shown you today are just the beginning... You'll also get a slew of new recommendations and portfolio updates delivered right to your inbox as soon as they're written.
-
Two Additional Shale Gas Plays – As I sit to write this, I've got two more shale gas plays that I'm just about ready to pull the trigger on...
- The Members-Only Crisis and Opportunity Website – This is just what you'd expect from a boots-on-the-ground guy like me: a no-nonsense archive of all my commentary, picks, current and past portfolios, and all the special reports I've written (just like the two I'll send you today for free).
- World-Class Customer Support – Whenever a question or problem arises, our support staff is there to help you with just a simple phone call. Receive live, immediate help Monday through Friday between 9 a.m. and 5 p.m. (EST).
- My Personal Guarantee – If at any time in the first 30 days you're not completely satisfied with the profits you're making with Crisis and Opportunity, just let me know. You'll receive a full refund of your subscription.
If you're still with me, I think you realize just how big this opportunity is.
You also know by now nothing in life is free — nothing good, anyway.
Over the years, I've made people absolute fortunes.
I could easily charge $5,000 for my research. I have before. And even
that price was a downright bargain based on how much my readers made...
So I'm thrilled to say if you're one of the first 500 readers to respond to this offer today, it'll only cost you $999 to join Crisis and Opportunity.
I realize that may still sound like a lot of money to you, but it's
the lowest price we've ever charged for my work and it's a small amount
compared to what you could make in your first trade.
My publisher wanted to charge a lot more. He said that the last time
I opened my service up to new members, the letter was about a small
Kenyan oil company. That stock went from $1.25 to $4.32 in four months
(and is still climbing)...
The time before that the stock I told you about went up 759% before we sold for a profit.
Remember, I regularly show my readers gains like:
- 115% on Cove Energy
- 351% on Entree Gold
- 515% on Palm Resources
And my Ring of Fire stocks are once-in-a-lifetime scores. Some people
wait years, decades, even their whole lives for something this big to
come along.
As I told you before, you have a full 30 days to decide if this type
of research is for you. That's 30 full days of risk-free profits from Crisis and Opportunity.
You also get the two free reports: "Profiting Big from the HR1380 Transportation Transformation" and "Water Profits: How a Tiny $0.75 Company Will Clean Up Fracking and Make You Rich."
They're yours to keep, no matter what.
I'd never be able to make you this offer if I wasn't 100% sure you'll love Crisis and Opportunity...
But don't just take my word for it.
I have a drawer full of letters like these from people thanking me for showing them how to make money hand over fist.
For just $999 a year, you can join them.
For 12 months' worth of retirement-securing plays, all you'll pay is about half what you'd pay a day for a good cup of coffee...
But remember, this offer is strictly limited to the first 500 people who sign up.
Once we hit 500 members, this offer will be closed out immediately — and you'll likely never see anything close to it again.
I'd hate to see you miss out on banking these once-in-a-lifetime gains on the Ring of Fire...
If you're not 100% happy with Crisis and Opportunity, you can get 100% your money back any time within the first 30 days (we will prorate any requests after that time).
What could be fairer?
I've done everything I can to make this a no-brainer...
I've shown you how two little-known companies could make you a "Ring of Fire millionaire."
I've given you the lowest price I can offer...
I've even arranged to give you 30 days to try it for free so you can invest in the companies I've detailed in "Profiting Big from the HR1380 Transportation Transformation" and "Water Profits: How a Tiny $0.75 Company Will Clean Up Fracking and Make You Rich."
It's time for you to act.
You can either seize this opportunity... or let it slip through your fingers and kick yourself later.
Don't miss out on your chance to secure your financial future.
Yours in Profits,
Christian DeHaemer
Investment Director , Crisis and Opportunity
P.S. Just as I was finishing up this report, another
company popped up on my radar screen... I've had my eye on it for
awhile, but the timing just hasn't been right — until now. Situations
change in the blink of an eye with red-hot markets, and I'll be pulling
the trigger on this company any day now. You have to get in now.
P.P.S. The report is called "Gas Transport
The ONLY way to trounce gold's gains without having to buy coins, ETFs, options, major gold mining stocks, or tiny exploration stocks...http://www.angelnexus.com/o/web/48908?lloct=2&r=1
Two years ago, a stunningly-profitable gold investment algorithm made waves as it passed by word of mouth from investor to investor in Vancouver's exclusive and famously secretive precious-metals mining community...
Back then, the gold bull run was in full swing, and this algorithm quickly became a buzzword... first among the pros and then, eventually, with anybody interested in profiting off the precious metal trend.
The algorithm — nicknamed "Compound Gold" by insiders and private investors — took advantage of rapidly-rising gold prices to tap profits into formerly dormant mining operations.
Gains from this investment strategy could multiply the percentage gained by gold bullion by factors of 5, 10, 20 — even 50-fold or more.
Best of all, it's such a simple strategy to employ, it could literally be accomplished through a single trade on your online trading account.
Among these investors was the legendary John Paulson, who'd previously made himself a household name when he banked $2 billion shorting the housing market.
When he made his relatively quiet Compound Gold investment in 2009, few people took notice...
You can bet that things weren't so quiet when, 15 months later, Paulson walked away with $314 million in profit — having traded just one stock.
Since those early days of the previous metals bull market, things have changed. If you've been keeping up to speed on gold prices these days, or the outlook for the future, things don't seem quite as bright and shiny as they once were... at least, not at first glance.
After peaking out just south of $1,900/ounce in September of 2011, the gold market's cooled, gradually meandering down to a low of $1,354 in May 2013 before settling at its current price of $1,400.
As strong as Compound Gold was during those post-crisis years, the algorithm cooled right along with the gold market.
Of course, as you well know, with every depreciation in price, a whole new set of opportunities opens up for a low buy-in.
With prices now stable about 25% down from their 2011 peak, private precious metals investors — as well as the institutional investors like Paulson who routinely close 8- and 9-figure returns — are starting to eye the yellow metal once again...
Which means Compound Gold is about to kick it into high gear once again for another round of super-charged profits.
This time, however, there's a wild card in play that did not exist the last time the algorithm activated during the post-crisis gold rush... a unique, highly-guarded investment that for the past two months, even as gold prices took a downturn, has broken all the rules by giving investors the kinds of returns not seen since before the 2011 peak.
But as prices stabilize, and conditions begin to reset to reactivate Compound Gold trading, mining industry insiders are waiting with bated breath to see the true potential of this wild card.
In the next few minutes, I'll tell you everything you need to know about this one-of-a-kind investment, how you can get yourself involved with just a couple clicks on your online brokerage account and, most importantly, the eye-popping returns it could bring you within days of entry.
Before I get to that, though, I want to explain to you how Compound Gold works and why now — just like during the crisis years — investment pros and industry insiders are waiting for it to reawaken.
The Insiders' Secret: Compound Gold
And that's precisely the problem with most companies that own property containing gold, silver, or anything else that's valuable...
Getting the valuable material out of the ground costs money... money that cuts into profits.
Cut enough of the profit and eventually, that land embedded with all those millions of ounces of gold and silver becomes worthless.
Just imagine... something worth billions of dollars — and nobody willing to shell out a dollar to own it.
Twenty-five years ago, when gold was trading at $350 and silver at $7, finding properties like this wasn't hard. More importantly, buying them was even easier.
Because no matter the size of the property — or how many million ounces of gold it held — anybody with an average-grade deposit who decided to start mining right then and there would be doomed to bankruptcy... making those properties worthless.
For those willing to bide their time, however, unimaginable fortune was around the corner.
Let's say you have a 3 million ounce gold deposit, an entry-level purchase for any major mining operation...
With cost of production at, for example, $400/ounce, that deposit would be functionally worthless when gold's market value is at $400/ounce. The owner would neither profit nor lose from the development of that property.
But if the market price rises by just a single dollar from that $400/ounce baseline...
That property suddenly becomes worth $3 million.
Historically, though, your gains would have been much, much bigger.
If you'd bought this 3 million ounce property back in February 1987, when gold was trading for $400/ounce, you'd have an asset with an overall value of zero dollars.
Three months later — when gold hit $470/ounce — that formerly worthless property would now be valued at $210 million.
By December of that year, with gold up to $500, it would worth $300 million.
Or if you want to look at it in terms of percentages gained:
Start with the same cost of production: $400/ounce...
If the market price of gold exceeded this $400 threshold — even by as little as 1% — this modest property which was worthless the day before... would suddenly become a $12 million dollar asset.
If a week later the price of gold went up a mere $8.00 per ounce (just 2%, based on mid-80s prices), the price of that suddenly valuable asset would double...
A 10% jump in gold price and the value is now up 1,000%.
But remember, the $400/ounce cost is just an example...
Every property — every mine — has its own specific break-even point.
Some higher-grade deposits break even below $400/oz, sending their stock skywards earlier on, while lower-grade properties break even well above $400/oz, launching their stock later.
The only trick is knowing that point and buying the stock when the market price of gold is as close to that point as possible: when the cost of production to gold market price ratio is near or at 1.
Hit that "sweet spot," and any subsequent jump in market price immediately launches the stock into exponential growth.
So it's not just a gold investment — but a Compound Gold investment, as it compounds incremental changes in gold price to generate major profits from a specialized type of property.
It's so efficient at gaining ground and so reliable, in fact, that Compound Gold trades have outpaced the world's single most popular gold investment, the SPDR Gold Trust (GLD) — which itself nearly doubled from $97 to $185 between November 2009 and late 2011 — by 458%.
And it doesn't just work for gold...
A company holding 85 million ounces of silver (not a large deposit by major industrial standards) that was worth zero dollars at $6/ounce... would be worth $17 million if the price of silver went up by just 20 cents.
If silver prices increase less than 10% — from $6 to $6.50 — our property would now be worth $43 million.
And if you'd bought this property in 1986... by the end of 1987, with silver at $10/ounce, this "worthless" property would have a net value of $340 million.
I know this comes off as amazing, but it's actually pretty simple; you just need the market to be heading in the right direction, and Compound Gold immediately picks up speed.
Here's what I mean:
When gold prices spiked back in the mid 1980s, millions of gold investors made 50%, 60%, as much as 80% on bullion.
A tiny handful of Compound Gold investors who had the skill and luck to find the right companies just as gold prices were reaching and exceeding their specific costs of production... made thousands of percent — hundreds of dollars returned for every dollar invested.
This sort of speed and reliability puts Compound Gold in a class of its own among gold investments.
It was so powerful that it gave rise to a whole new class of investors — and helped the precious metals mining industry explode into the sector it is today.
But here's the catch: There are times when this method simply won't work.
You see, back in the 80s, we were in the midst of one of modern history's greatest precious metals bull markets. But just before the run started in 1985, a few people who knew what was coming went around deserted stretches of land in North and South America, buying up seemingly worthless tracts of land — land where there were proven gold deposits, but where the cost of production would bankrupt a company in short order.
And then the boom hit — and it was time to sit back and watch the profits collect.
Of course, nothing good lasts forever. When the precious metals bull market cooled off in the 1990s, anybody working this tactic would have to stop operations... and wait until the next one.
That next one came around after the economy crisis of 2008... and lasted a good three years before this most recent cooling off of the market.
But now, it looks like we've finally hit the reset button. And with gold just barely touching $1,400/ounce, there's a lot of room for growth in the near term.
As you just learned reading about the simple mechanism behind Compound Gold, with each dollar that gold gains... properties and companies that had never been profitable suddenly cross over into the black and transform overnight.
It paused for a while after the 2011 peak — but as prices hit multi-year lows, the moment to take full advantage of it all over again is here now.
The New Bull Market is Just Getting Started...
The U.S. manufacturing base has been shipped overseas. The few jobs being created are in the service industry or government sector. The official unemployment rate hovers near 10%, and 1 out of every 5 Americans is on food stamps. The 2008 economic implosion destroyed the real estate market, sent foreclosures skyrocketing, and swallowed up a nearly $1 trillion bailout... and yet, most experts predict the worst is still to come.
2) Fear
The sovereign debt crisis threatens to spread across the globe. Fearful investors are shifting assets from the euro and other weakening currencies into gold. The stock market rebounded from its 2008-09 depths, but some analysts say it's overbought and due for painful correction. Meanwhile, turmoil across the Middle East, Asia, and elsewhere is exacting huge costs in American blood and treasure...
3) Demand
The Federal Reserve has kept U.S. interest rates at virtually zero with no sign of a hike on the horizon, thereby lowering the opportunity cost of buying gold. And investors have responded with astonishing eagerness, even forcing the U.S. Mint to ration popular bullion products in order to meet overwhelming demand. Expect central banks in China, India, and Russia to fuel demand for gold.
4) ReflationOf the major assets, only Treasuries and gold have escaped the selling panic that has gripped the markets. Rushes on gold have caused mints around the world to run out of popular gold coins. Because of the inflationary impact of government bailouts, $2,000 could be the floor, not the ceiling.
5) The DollarDollar weakness, plentiful liquidity, and policy reflation will be persistent themes in the future. Massive fiscal and monetary stimulus have weakened the dollar, whose current resurgence stems mainly from the European debt crisis. Once that crisis reaches the debt-burdened United States, the dollar's weakness as a currency will be evident to all — and its role as the world's reserve currency will be in jeopardy. As always, gold will be the first and most universal remedy.
Companies with production costs at or near today's Compound Gold sweet spot are more common today because there is so much more room to profit.
The profit potential for this highly-specialized breed of companies is simply staggering — easily as strong as it was in the days when Paulson made his storied purchases, and far, far in excess of anything we saw back in the early bull runs of the 1980s.
Remember, for gold to just rise a few dollars is enough for these stocks to start doubling or tripling.
Dare to think big, though, and you'll see the real opportunities start to materialize...
If gold itself doubles, you could be looking at 100, 500, even 1,000 times your initial investment.
Just imagine investing $1,000 today... and in two years, cashing out a cool million.
All that matters is finding the right company — with the right cost of production levels — and waiting for that sweet spot.
I know what you're going to say: All these theories and stories are great... but you want to see a live example of what happens when a company hits the Compound Gold sweet spot.
Instantly in the Black: South American Silver Corp
In October of 2009, South American Silver Corp. (SAC) was a tiny $13 million company trading at 13 cents a share.
Investors looking at just the stock value would have been misled, because within SAC's property in Bolivia was an estimated 322 million ounces of silver.
Even at 2009 prices, this deposit had a theoretical value of over $5.1 billion.
But here's where the algorithm comes in...
Because the low-grade ore found in great abundance on this property would cost about $20/ton to process into raw silver, the owners of this property would have been losing $2/ton on their investment (at late 2009 silver prices).
Their $5.1 billion asset wasn't an asset at all. It was a liability.
But over the next 20 months, the price of silver did something spectacular:
In a rally to rival all rallies, silver jumped from $18.50 an ounce to over $50!
That's a gain of over 170%.
Not bad, right? You could have invested $10,000, and by the summer of 2011, cashed out with $27,000.
But remember this: At $18/ounce, SAC was virtually worthless... but at $50/ounce, less than two years later, this company was profiting $32/ounce!
At that price, the entire property had a total resource value of $16.1 billion — with $10.3 billion of that being pure profit.
In case you can't imagine what that does to a company's stock price, here's what South American Silver Corp looked like as it passed its sweet spot last year:
Between September 2009 and April 2011, South American Silver went from 13 cents to over $3.00 for a gain of 2,307%.
So if instead of putting that $10k into raw silver, you bought SAC just as its cost of production hit that sweet spot...
You'd have made a pre-tax profit of $230,000.
It's not a trick, it's not a fluke, and you don't need any specialized brokers or understanding of finance to execute... With a single trade, anybody who knew the cost of silver production for this one Bolivian property would have made millions in less than two years' time.
Want another example?
Here's Copper Mountain Mining Corporation (CUM).
It hit its break-even price back at the end of 2008, when gold prices were at $800/ounce. In the two years since, as the sweet spot came and went, the stock looked like this:
So while gold doubled to $1,830 an ounce in the 26 months following that magical sweet spot, this company went from 40 cents to $8.00 — a self-sustained gain of 2,000%.
The gains took the company up from a tiny $30 million exploration outfit to an exploding $600 million gold mining powerhouse... and would have turned a $10k investment into $200,000.
Here's a third example: Agnico-Eagle Mines Ltd. (AEM).
This one goes back more than a decade — and illustrates the point that every property has its own specific break-even point, which can be exploited.
As the gold market picked up after going through a dry patch in the 90s, the profits on paper suddenly materialized, and the value of this company's property shot up exponentially.
It took a little while longer than usual, but in the end it was a monster success story — gaining 2,600% as it climbed from $3 to $80.
Not convinced?
Here's yet another example...
This wasn't that small of a company to begin with, but an established firm worth hundreds of millions. Regardless, its rise was so easy to predict — and so reliable — that billionaire investor and hedge fund superstar John Paulson bought a full 18% of the company.
The purchase was just one of the many gold investments he made that year... Paulson also invested heavily in physical gold, as well as a number of larger North American producers.
But this play was by far the strongest-gainer of the bunch, helping to make 2010 the biggest year of his already legendary career.
"Mr.
Paulson, a hedge fund manager who sprang to fame when the housing
market collapsed, personally made about $5 billion in 2010, according to
two investors in his company." — NY Times
If the several examples above don't convince you, here are a few more:1.) International Tower Hill Mines Limited (THM): December 2008: 98 cents — January 2011: $10.00 (1,020% GAIN)
2.) Northern Dynasty Minerals (NAK): November 2008: $1.80 — February 2011: $21.90 (1,216% GAIN)
3.) Teck Resources Limited (TCK): March 2009: $3.30 — January 2011: $61.00 (1,848% GAIN)
4.) New Gold Inc. (NGD): December 2008: $1.70 — August 2011: $13.07 (768% GAIN)
5.) Osisko Mining Corporation (OSK.TO): December 2008: 75 cents — December 2010 $16.00 (2,133% GAIN)
And that's just a small sampling...
Which illustrates my final point: Professional investors and industry insiders have been banking billions off this method for years.
In other words, using this basic principal isn't a new or novel idea. In fact, many of the professional commodities investors refuse to make any trades in which this algorithm hasn't predicted success.
Unfortunately, this simple yet essential system of investment is almost completely overlooked by do-it-yourself investors. This baffles me, but it's just a fact of life in today's financial world...
A vast majority of today's investors have simply never heard of Compound Gold — nor do they understand the basic principal behind its pattern of success.
So you can already consider yourself a member of the elite. After all, you already know how and why this system works and the basic principal behind putting it into action to make yourself tens, even hundreds of times your money back in short order.
But picking the right company can still be tricky... There are so many to choose from, and digging through quarterly financial statements to come up with that perfect cost-of-production isn't exactly a weekend activity for everyone.
To my good friend and colleague, precious-metals guru Greg McCoach, it's a full-time job — and a career-long obsession.
And what he recently discovered is a company that's turned the Compound Gold concept on its head.
I Don't Specialize in an Industry; I Specialize in Making Money
One of our closest industry contacts — and one of my long-time friends — is the editor of our precious-metals newsletter, Mining Speculator. His name is Greg McCoach. Greg has been a specialist in the field for over two decades. And he's asked me to write him an intro to bring Compound Gold to a never-before tapped audience...
Just recently, Greg identified a gold mining company that seems to have shattered the mold.
This company — trading at around 70 cents — is still considered a junior miner.
For the last two months, it's been doing something quite remarkable...
While gold's been declining, eventually settling down at $1,400, this company's stock was flourishing — more than tripling in just several weeks in May of 2013!
Now, Greg's had this eye on the company for awhile, before any of this recent movement started.
The reason? He's got a proven method for weeding out the true winners from among the scores of average mining companies operating in this sector.
Over the past 25 years, Greg's experience has shown that there are three critical elements to raking in eye-popping returns...
#1. The Advantage of Junior Mining Companies
Why invest in juniors?
That's easy — money and unparalleled leverage.
You see, it's not uncommon for junior-mining companies to experience huge gains (tenfold or more) very quickly as news of a discovery leaks out.
"When I first met you, you told
me I could use the profits I would make in the mining stocks to pay off
my house. I didn't really believe you. Two and a half-years later I
recently wrote a check to do just that. I never thought this would be
possible. Thank you so much for your wise guidance." — Robert, Illinois.
On top of that, the resurging bull market in precious metals not only
focuses more attention on the sector, but also causes even more money
to be spent on exploration...And the payback on a new find increases exponentially.
You see, in the mining world, it's no secret that most mineral deposits are found by junior mining companies and individual prospectors.
There are several reasons for this:
Junior explorers are not slow-moving bureaucracies like many senior
companies; juniors make fast decisions both in the boardroom and in the
field.Senior
resource companies generally have a different role to play — namely, to
fund and put into production deposits discovered and developed by
juniors.When investing in a junior mining company, you're investing in its management team as much as you are in its promising projects... which leads us to the second critical element to raking in eye-popping returns...
#2. Know the Management Team Inside and Out
When Greg studies a company, he spends hours, days, and weeks with CEOs and geologists — even with companies he never actually recommends!
This is the only way to truly get a feel for their expertise.
After all, in the mining business, if an exploration geologist finds a mine, it's likely that he'll find others...
It's a fact that far fewer than 5% of all exploration geologists will ever be credited with a discovery leading to a producing mine. What's more, less than one out of every 1,000 exploration sites will ever turn into a mine.
But those select, gifted explorers who find numerous mines seem to have a sixth sense that helps them to succeed.
Finding these geologists isn't the easiest task in the world. But they're all drawn to it for the same reason: money.
It's the huge potential that comes when a discovery is made.
You see, as part of a junior mining company, the geologist who makes the discovery might get $10 million, $20 million, or $100 million in capital gains for his efforts.
After all, in the life cycle of a mining stock, it's the exploration phase that provides the biggest move in share price (leverage).
The best and brightest mine finders know it. And they'll search the world over to make a new discovery.
When they do, the monetary rewards are tremendous — for both the management team and for investors.
#3. The Simplest and Most Overlooked Part of Making a Fortune in Investing
It's best summed up by J. Paul Getty, one of the most successful investors of modern times.
What did Getty know about building wealth and investing for spectacular gains that his contemporaries didn't?
Several years before he died, Getty shared his "secret" in his autobiography...
He explained that whenever he made an investment, he tried to apply this simple principal: If you want to make money, really big money, do what nobody else is doing.
In Getty's own words, "Buy when everyone else is selling and hold until everyone else is buying."
This isn't merely a catchy slogan. It's the very essence of successful investing.
But as simple as it sounds, too many people do just the opposite. They buy high and sell low. They're trend followers. To put it more bluntly, they follow the crowd.
The successful investor is a trendsetter, not a trend follower. He gets in — and out — ahead of the crowd.
Now, the company I've been teasing this whole time clearly falls into all three categories:
1.) It's a junior miner — and trading
just north of 70 cents, it's in the very middle of the pack. Not too
small. And not too big (for now at least)...
2.) It boasts a highly-successful
management team. A recent discovery reconfirmed what Greg already knew —
that this team is a winner.
3.) It's a gold-miner — and as you
know, the trend right now, despite all common sense, is to be bearish on
gold. Your average investors are selling... That means those who will
ultimately profit, are buying, now, and buying big.
In addition:- It's got a super-tight share structure, with just 39 million shares
outstanding. This is music to an investor's ears, because sparse
sharepools mean when the stock moves, it moves fast...
- Almost 1/3 of this company's worth (over $8 million) is in cash — making this company not just well prepared for the next round of exploration, but its stock well rooted in liquid assets.
You'll Make Triple-Digit Gains — OR IT'S FREE!
Most resource and mining traders would be happy to pay upwards of $2,000 and as high as $5,000 to get the jump on a Greg McCoach play. To them, it's minuscule overhead for the profit potential they're getting.
Right now, Greg is offering this report along with a year's subscription to Mining Speculator for just $49.
That's less than 15 cents a day for a shot at making thousands in one simple trade.
I pleaded with him not to go so low on his subscription fees, but instead of listening, Greg took it a step further... and I had no choice but to accept his terms.
He's so certain your Compound Gold stock will go up by at least 100% before the coming winter that if it doesn't work — for whatever reason — Greg and I will refund every penny of your subscription to Mining Speculator.
Bottom line: Either you double your money in the next six months — or you pay nothing.
No small print, no exceptions, no excuses.
Make 100% or get your money back. Period.
And listen, if at any point during your first six months you're unhappy for any reason at all, just say the word and I'll send you a check in the amount of your subscription fee...
6 full months. Any reason at all. No questions asked.
No matter what you decide, however, you get to keep your copy of Greg's breaking report, called: "Compound Gold: Ride the Gold Bull to Exponential Gains."
For the introductory price of $49 you will also receive:
- 12 Issues of Greg's monthly advisory, The Mining Speculator
- Research Report #1 — "The Most Explosive Junior Silver Stock of 2013"
- Research Report #2 — "The Yukon's Best: The Easiest Gold Gains You'll Ever Make"
The upside here is staggering. I'm not exaggerating in the slightest when I say that this opportunity can potentially alter your life forever.
But you must move quickly...
Because this opportunity is so explosive — and because this company is still a closely-guarded secret within the investment community — I am limiting the number of subscriptions to just 200.
Once we hit that number, I'm closing the file, sitting back, and waiting for the real action to start.
The way things are progressing in the gold market, I wouldn't be surprised to see my new recommendations double or even triple in the coming weeks...
Things are only going to move faster, and you need to position yourself now to ensure full profit potential.
So please, take a moment right now to reserve your space.
However you choose to order, please do it now.
This opportunity won't wait...
Good Investing,
Jeff Siegel for Angel Publishing
P.S. This trade must be executed within the next seven days. With the recent fluctuations in gold prices, and with major movement on Greg's new gold mining stock, I cannot guarantee that this opportunity will be around much longer... Every day is another day of lost gains. Don't miss out an another dollar of profit — click the button below.
Tidak ada komentar:
Posting Komentar